Reading EBSD Data
To read experimental electron backscatter diffraction (EBSD) data three components are needed
EBSDMeshMesh objectEBSDReaderUserObjectInitial conditions (such as the
ReconVarICaction provides)
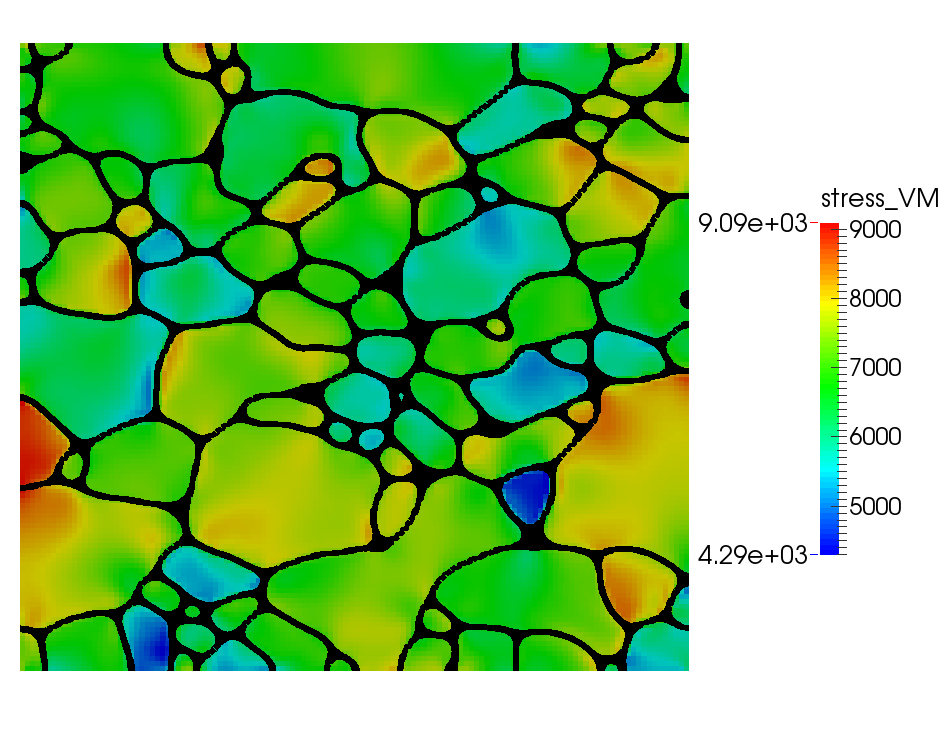
Reconstructed microstructure with stress, created using the combined module example file EBSD_reconstruction_grain_growth_mech.i
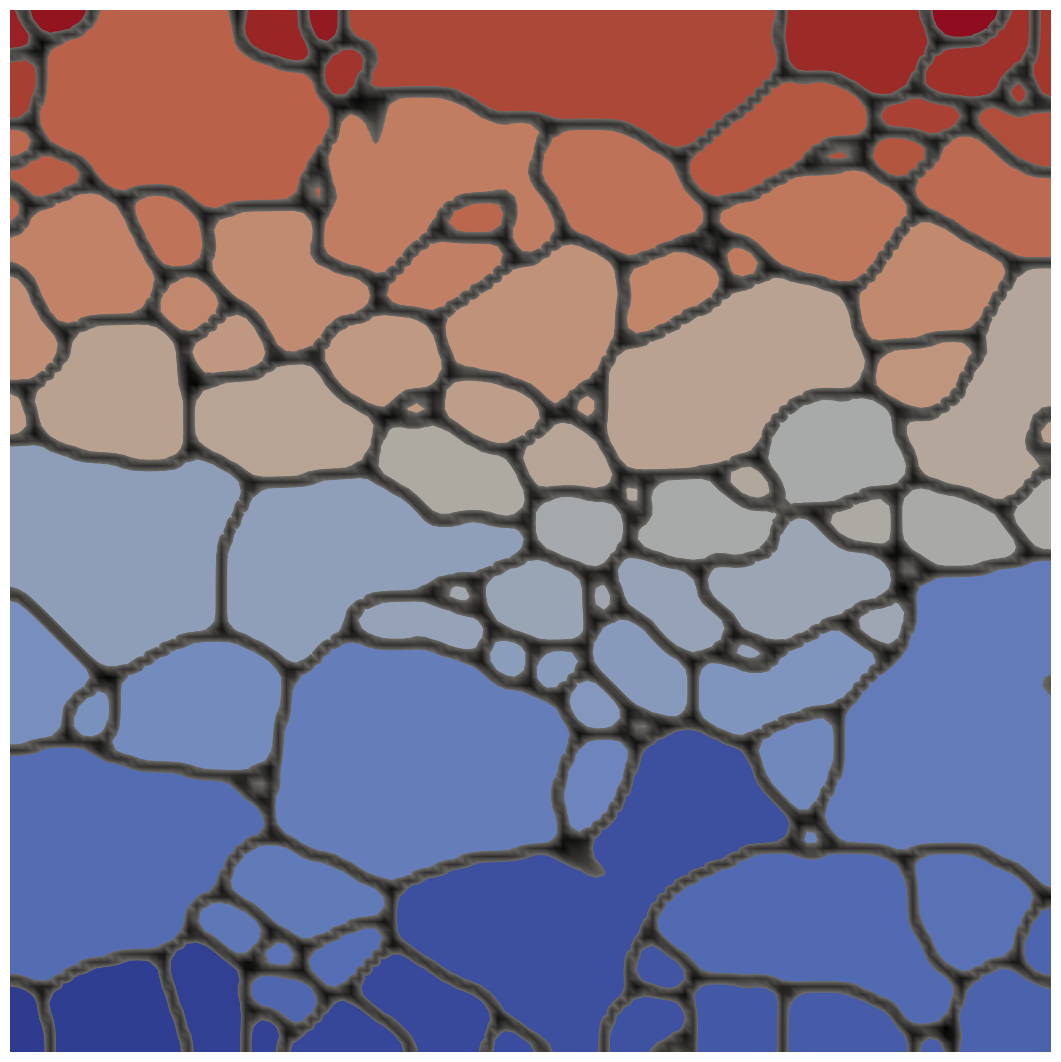
Reconstructed microstructure using EBSDReader, created using the phase_field module example file IN100-111grn.i
Mesh
The mesh is generated from the EBSD information in the specified EBSD data file to get an optimal reconstruction of the data. This is accomplished in the mesh block using the EBSDMesh type. The mesh is created with one node per data point in the EBSD data file. If you wish to use mesh adaptivity and allow the mesh to get coarser during the simulation, the uniform_refine parameter is used to set how many times the mesh can be coarsened. The block takes the form:
[Mesh<<<{"href": "../../../syntax/Mesh/index.html"}>>>]
  [ebsd_mesh]
    type = EBSDMeshGenerator<<<{"description": "Mesh generated from a specified DREAM.3D EBSD data file.", "href": "../../../source/meshgenerators/EBSDMeshGenerator.html"}>>>
    filename<<<{"description": "The name of the file containing the EBSD data"}>>> = IN100_120x120.txt
    pre_refine<<<{"description": "Number of coarsening levels available in adaptive mesh refinement. The resulting mesh will have one mesh element per EBSD data cell, but will be based on a refined coarser mesh with 'pre_refine' levels of refinement. This requires all dimension of the EBSD data to be divisible by 2^pre_refine.(this parameter was formerly called 'uniform_refine')"}>>> = 2
  []
[]EBSD Reader UserObject
The UserObject reads in the data file, using the name supplied in the mesh block, and stores a data object with the local data at each material point as well as the average data about each grain. The block syntax is very simple:
[UserObjects<<<{"href": "../../../syntax/UserObjects/index.html"}>>>]
  [ebsd_reader]
    type = EBSDReader<<<{"description": "Load and manage DREAM.3D EBSD data files for running simulations on reconstructed microstructures.", "href": "../../../source/userobjects/EBSDReader.html"}>>>
  []
  [ebsd]
    type = PolycrystalEBSD<<<{"description": "Object for setting up a polycrystal structure from an EBSD Datafile", "href": "../../../source/userobjects/PolycrystalEBSD.html"}>>>
    coloring_algorithm<<<{"description": "The grain neighbor graph coloring algorithm to use: \"jp\" (DEFAULT) Jones and Plassmann, an efficient coloring algorithm, \"power\" an alternative stochastic algorithm, \"greedy\", a greedy assignment algorithm with stochastic updates to guarantee a valid coloring, \"bt\", a back tracking algorithm that produces good distributions but may experience exponential run time in the worst case scenario (works well on medium to large 2D problems)"}>>> = bt
    ebsd_reader<<<{"description": "EBSD Reader for initial condition"}>>> = ebsd_reader
    enable_var_coloring<<<{"description": "Instruct the Postprocessor to populate the variable index map."}>>> = true
  []
  [grain_tracker]
    type = GrainTracker<<<{"description": "Grain Tracker object for running reduced order parameter simulations without grain coalescence.", "href": "../../../source/postprocessors/GrainTracker.html"}>>>
    flood_entity_type<<<{"description": "Determines whether the flood algorithm runs on nodes or elements"}>>> = ELEMENTAL
    compute_halo_maps<<<{"description": "Instruct the Postprocessor to communicate proper halo information to all ranks"}>>> = true # For displaying HALO fields
    polycrystal_ic_uo<<<{"description": "Optional: Polycrystal IC object"}>>> = ebsd
  []
[]

[ICs<<<{"href": "../../../syntax/ICs/index.html"}>>>]
  [PolycrystalICs<<<{"href": "../../../syntax/ICs/PolycrystalICs/index.html"}>>>]
    [PolycrystalColoringIC<<<{"href": "../../../syntax/ICs/PolycrystalICs/PolycrystalColoringIC/index.html"}>>>]
      polycrystal_ic_uo<<<{"description": "Optional: TODO"}>>> = ebsd
    []
  []
[]Applying Initial Conditions
The initial condition for the variables is set from the EBSD data. There are three possible use cases summarized below.
Case 1: Create grain structure from the grain numbers in the EBSD data, ignoring the phase number
A grain structure is created from the EBSD data by assigning initial condition values for order parameters. Many more grains can be represented than the number of order parameters. The required blocks are
[Mesh<<<{"href": "../../../syntax/Mesh/index.html"}>>>]
  # Create a mesh representing the EBSD data
  [ebsd_mesh]
    type = EBSDMeshGenerator<<<{"description": "Mesh generated from a specified DREAM.3D EBSD data file.", "href": "../../../source/meshgenerators/EBSDMeshGenerator.html"}>>>
    filename<<<{"description": "The name of the file containing the EBSD data"}>>> = IN100_001_28x28_Marmot.txt
  []
[]

[GlobalParams<<<{"href": "../../../syntax/GlobalParams/index.html"}>>>]
  # Define the number and names of the order parameters used to represent the grains
  op_num = 4
  var_name_base = gr
[]

[UserObjects<<<{"href": "../../../syntax/UserObjects/index.html"}>>>]
  [ebsd_reader]
    # Read in the EBSD data. Uses the filename given in the mesh block.
    type = EBSDReader<<<{"description": "Load and manage DREAM.3D EBSD data files for running simulations on reconstructed microstructures.", "href": "../../../source/userobjects/EBSDReader.html"}>>>
  []
  [ebsd]
    type = PolycrystalEBSD<<<{"description": "Object for setting up a polycrystal structure from an EBSD Datafile", "href": "../../../source/userobjects/PolycrystalEBSD.html"}>>>
    coloring_algorithm<<<{"description": "The grain neighbor graph coloring algorithm to use: \"jp\" (DEFAULT) Jones and Plassmann, an efficient coloring algorithm, \"power\" an alternative stochastic algorithm, \"greedy\", a greedy assignment algorithm with stochastic updates to guarantee a valid coloring, \"bt\", a back tracking algorithm that produces good distributions but may experience exponential run time in the worst case scenario (works well on medium to large 2D problems)"}>>> = bt
    ebsd_reader<<<{"description": "EBSD Reader for initial condition"}>>> = ebsd_reader
    output_adjacency_matrix<<<{"description": "Output the Grain Adjacency Matrix used in the coloring algorithms. Additionally, the grain to OP assignments will be printed"}>>> = true
  []
  [grain_tracker]
    type = GrainTracker<<<{"description": "Grain Tracker object for running reduced order parameter simulations without grain coalescence.", "href": "../../../source/postprocessors/GrainTracker.html"}>>>
    # For displaying HALO fields
    compute_halo_maps<<<{"description": "Instruct the Postprocessor to communicate proper halo information to all ranks"}>>> = true
    # Link in the ebsd userobject here so that grain tracker can extract info from it
    polycrystal_ic_uo<<<{"description": "Optional: Polycrystal IC object"}>>> = ebsd
  []
[]

[Variables<<<{"href": "../../../syntax/Variables/index.html"}>>>]
  [PolycrystalVariables<<<{"href": "../../../syntax/Variables/PolycrystalVariables/index.html"}>>>]
    # Create all the order parameters
    order<<<{"description": "Specifies the order of the FE shape function to use for the order parameters"}>>> = FIRST
    family<<<{"description": "Specifies the family of FE shape function to use for the order parameters"}>>> = LAGRANGE
  []
[]

[ICs<<<{"href": "../../../syntax/ICs/index.html"}>>>]
  [PolycrystalICs<<<{"href": "../../../syntax/ICs/PolycrystalICs/index.html"}>>>]
    [PolycrystalColoringIC<<<{"href": "../../../syntax/ICs/PolycrystalICs/PolycrystalColoringIC/index.html"}>>>]
      # Uses the data from the user object 'ebsd' to initialize the variables for all the order parameters.
      polycrystal_ic_uo<<<{"description": "Optional: TODO"}>>> = ebsd
    []
  []
[]Case 2: Initialize a variable from a specific phase number in the EBSD data, ignoring the grain numbers
Here, the value for a single variable is initialized from the EBSD data corresponding to a single phase number. The required blocks are
[Mesh<<<{"href": "../../../syntax/Mesh/index.html"}>>>]
  # Create a mesh representing the EBSD data
  [ebsd_mesh]
    type = EBSDMeshGenerator<<<{"description": "Mesh generated from a specified DREAM.3D EBSD data file.", "href": "../../../source/meshgenerators/EBSDMeshGenerator.html"}>>>
    filename<<<{"description": "The name of the file containing the EBSD data"}>>> = 'Ti_2Phase_28x28_ebsd.txt'
  []
[]

[UserObjects<<<{"href": "../../../syntax/UserObjects/index.html"}>>>]
  [ebsd]
    # Read in the EBSD data. Uses the filename given in the mesh block.
    type = EBSDReader<<<{"description": "Load and manage DREAM.3D EBSD data files for running simulations on reconstructed microstructures.", "href": "../../../source/userobjects/EBSDReader.html"}>>>
  []
[]

[Variables<<<{"href": "../../../syntax/Variables/index.html"}>>>]
  # Creates the two variables being initialized
  [c1]
  []
  [c2]
  []
[]

[ICs<<<{"href": "../../../syntax/ICs/index.html"}>>>]
  [phase1_recon]
    # Initializes the variable info from the ebsd data
    type = ReconPhaseVarIC<<<{"description": "Sets the initial condition of the phase weights from the EBSD reader", "href": "../../../source/ics/ReconPhaseVarIC.html"}>>>
    ebsd_reader<<<{"description": "The EBSDReader object holding the EBSD data"}>>> = ebsd
    phase<<<{"description": "EBSD phase number this variable is to represent"}>>> = 1
    variable<<<{"description": "The variable this initial condition is supposed to provide values for."}>>> = c1
  []
  [phase2_recon]
    type = ReconPhaseVarIC<<<{"description": "Sets the initial condition of the phase weights from the EBSD reader", "href": "../../../source/ics/ReconPhaseVarIC.html"}>>>
    ebsd_reader<<<{"description": "The EBSDReader object holding the EBSD data"}>>> = ebsd
    phase<<<{"description": "EBSD phase number this variable is to represent"}>>> = 2
    variable<<<{"description": "The variable this initial condition is supposed to provide values for."}>>> = c2
  []
[]Case 3: Create an initial grain structure from the EBSD data only corresponding to one phase number Here, the grain and phase numbers are used. The order parameters are initialized from the EBSD data, but only using those grains with a given phase number.
[Mesh<<<{"href": "../../../syntax/Mesh/index.html"}>>>]
  [ebsd_mesh]
    type = EBSDMeshGenerator<<<{"description": "Mesh generated from a specified DREAM.3D EBSD data file.", "href": "../../../source/meshgenerators/EBSDMeshGenerator.html"}>>>
    filename<<<{"description": "The name of the file containing the EBSD data"}>>> = Ti_2Phase_28x28_ebsd.txt
  []
[]

[GlobalParams<<<{"href": "../../../syntax/GlobalParams/index.html"}>>>]
  op_num = 2
  var_name_base = gr
[]

[UserObjects<<<{"href": "../../../syntax/UserObjects/index.html"}>>>]
  [ebsd_reader]
    type = EBSDReader<<<{"description": "Load and manage DREAM.3D EBSD data files for running simulations on reconstructed microstructures.", "href": "../../../source/userobjects/EBSDReader.html"}>>>
  []
  [ebsd]
    type = PolycrystalEBSD<<<{"description": "Object for setting up a polycrystal structure from an EBSD Datafile", "href": "../../../source/userobjects/PolycrystalEBSD.html"}>>>
    coloring_algorithm<<<{"description": "The grain neighbor graph coloring algorithm to use: \"jp\" (DEFAULT) Jones and Plassmann, an efficient coloring algorithm, \"power\" an alternative stochastic algorithm, \"greedy\", a greedy assignment algorithm with stochastic updates to guarantee a valid coloring, \"bt\", a back tracking algorithm that produces good distributions but may experience exponential run time in the worst case scenario (works well on medium to large 2D problems)"}>>> = bt
    ebsd_reader<<<{"description": "EBSD Reader for initial condition"}>>> = ebsd_reader
    phase<<<{"description": "The phase to use for all queries."}>>> = 1
    output_adjacency_matrix<<<{"description": "Output the Grain Adjacency Matrix used in the coloring algorithms. Additionally, the grain to OP assignments will be printed"}>>> = true
  []
[]

[Variables<<<{"href": "../../../syntax/Variables/index.html"}>>>]
  [PolycrystalVariables<<<{"href": "../../../syntax/Variables/PolycrystalVariables/index.html"}>>>]
  []
[]

[ICs<<<{"href": "../../../syntax/ICs/index.html"}>>>]
  [PolycrystalICs<<<{"href": "../../../syntax/ICs/PolycrystalICs/index.html"}>>>]
    [PolycrystalColoringIC<<<{"href": "../../../syntax/ICs/PolycrystalICs/PolycrystalColoringIC/index.html"}>>>]
      # select only data for phase 1 from the EBSD file
      polycrystal_ic_uo<<<{"description": "Optional: TODO"}>>> = ebsd
    []
  []
[]Using EBSD Crystal Info
The EBSDReader local grid data is extracted using the getData(Point) function call, where you pass in location of the point where you want the data. The available data that can be extracted for a given point is
phi1- The first Euler anglephi- The second Euler anglephi2- The third Euler anglegrain- The index of the grainphase- The index of the phasesymmetry- The symmetry class (from TSL)
An example of using this function is shown here
const EBSDReader::EBSDData & d = _ebsd_reader.getData(p);
_euler_angles(0) = d.phi1;
_euler_angles(1) = d.phi;
_euler_angles(2) = d.phi2;
The EBSDReader average grain data is extracted using the getAvgData(unsigned int) function call, where you pass in the grain number for which you want the data. The available data that can be extracted
phi1- The average first Euler anglephi- The average second Euler anglephi2- The average third Euler anglephase- The index of the phase of the grainsymmetry- The symmetry class (from TSL)p- Point with centroid location
An example of using this function is show here, taken from ReconVarIC
const EBSDReader::EBSDAvgData & d = _ebsd_reader.getAvgData(grn_index);
_centerpoints[gr] = d.p;
Plotting Color Representation of Crystal Orientations

Reconstructed microstructure with the color representation of the inverse polefigure description of the crystal orientations. Image created using the phase_field module example file IN100-111grn.i.
It is common to use an inverse pole figure representation of the crystal orientations to color the grains to represent EBSD data. To simplify the comparison with experiments, MOOSE has a tool for outputting color values for the inverse pole figure representation that can then be visualized using Paraview. The spatially varying red, green, and blue (RGB) values are outputted as auxvariables that are automatically read by Paraview as a vector.
Two Auxkernels can be used to output the RGB values. The first, EulerAngleProvider2RGBAux is the simplest but requires the entire domain to have the same crystal structure. The second, EulerAngleVariables2RGBAux requires various other auxvariables that contain the Euler angles, the crystal structure, and the phase number.
The easiest way of outputting the values is to use a custom action block in the input file that is available. The syntax is
[Modules]
  [./PhaseField]
    [./EulerAngles2RGB]
      crystal_structure = cubic
      euler_angle_provider = ebsd
      grain_tracker = grain_tracker
    [../]
  [../]
[]
We recommend you plot the colors using Paraview. The EulerAngle2RGB action will create three auxvariables with default names RGB_x, RGB_y, and RGB_z. Paraview will automatically create a vector variable of name RGB_. To correctly represent the colors,
Select
RGB_as the visualization variable.In the properties section with the advanced properties toggled on, uncheck
Map ScalarsunderScalar Coloring.